
Case study · Cleaning
Solar panel cleaning in Liestal (BL).Before, after, and what the system monitoring shows.
- Location
- Liestal (BL)
- Visit
- 15 October 2026
- Service
- Brushing and limescale-free rinse
- Measured with
- The system monitoring app
What we found
Up close, the panel surface was covered with a film of dust and deposits, heavier along the frames. From the ground nothing shows: only the output gives it away.
The visit
Panel by panel with a soft brush, then a rinse with limescale-free water, softened on site, to carry away what the brush lifted without leaving white marks on the glass. The video was filmed on the roof during the visit.
The measurements
Same system, same time of day, before and after.
Two readings from the monitoring app at 1:20 pm: on 12 October, three days before the cleaning, and on 15 October, the day of the visit.
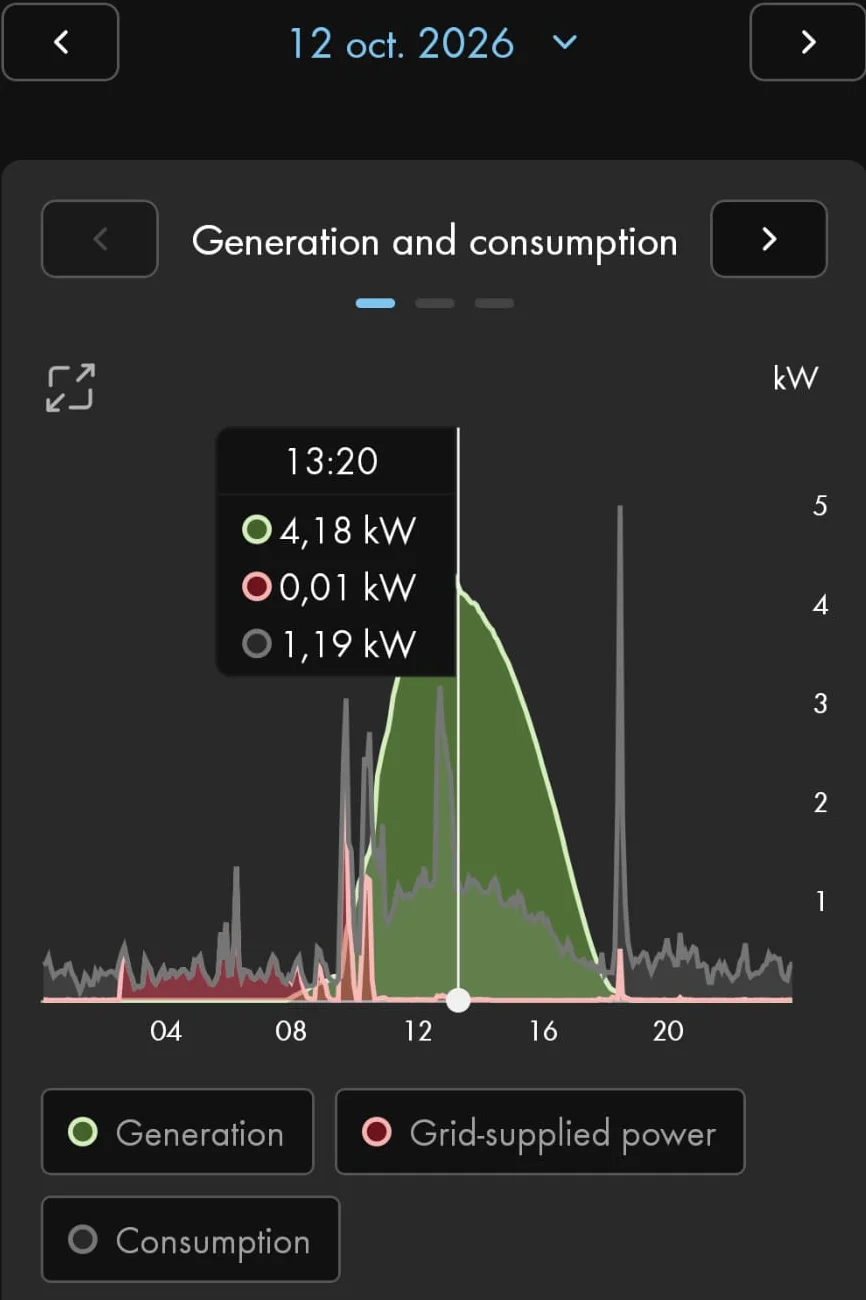
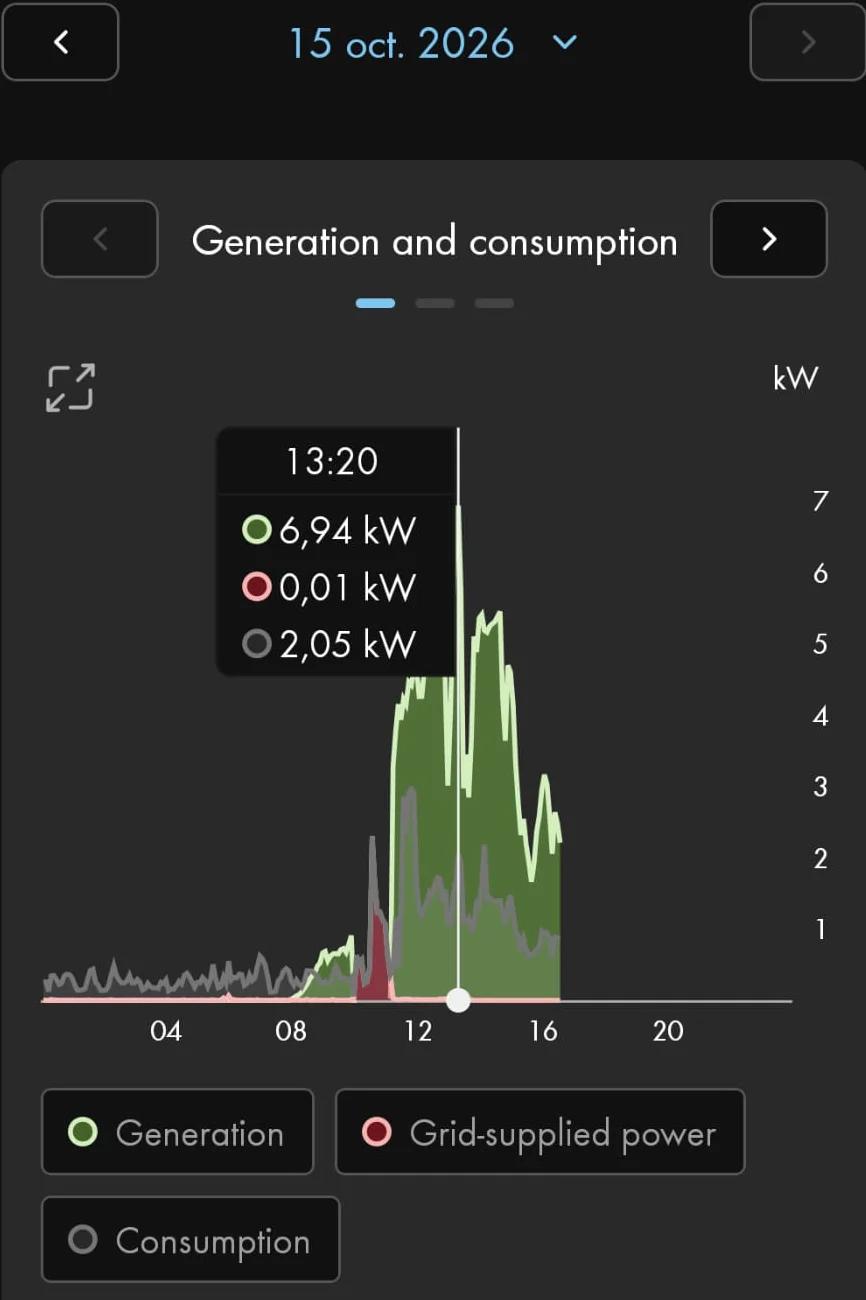
Solar generation at 1:20 pm
Values at 1:20 pm
| 12 Oct | 15 Oct | |
|---|---|---|
| Solar generation | 4.18 kW | 6.94 kW |
| Household consumption | 1.19 kW | 2.05 kW |
| Drawn from the grid | 0.01 kW | 0.01 kW |
The result
The cleaning clearly raised the system's output. On 12 October, under a clear sky, it never went above about 4.2 kW. On the 15th, after the visit, it passed 5 kW several times, even though the sky was changeable.
We do not put a percentage on this gain, as it depends on the weather of the day. The direction, though, is beyond doubt: clean panels catch more light and produce more.
Worth knowing
- On 12 October the sky was clear: the curve is smooth. On the 15th it was changeable: the curve is jagged. Under broken cloud, output can briefly exceed clear-sky output.
- The app scales each chart to the day's peak (5 kW on the 12th, 7 kW on the 15th): compare the values rather than the height of the curves.
- The reading for the 15th was taken at 4:40 pm: the day was not over yet.
Panels left without cleaning for more than two years?
Our cleaning service →